We all know that fireworks are a true particulate matter champion. But did you know that a wood-burning stove is also a source of a great deal of particulate matter? Is it possible that a wood-burning stove can emit more fine dust than the fireworks during the New Year from 2019 to 2020? We use citizen science to answer this question. We have received permission to use the data from a location from our measurement network to investigate this question. This location is in a typical residential area and the location is equipped with several particulate matter sensors.
We compare the measurement data from 17 November 2019 with the turn of the year from 2019 to 2020. On 17 November, there was a lot of nuisance from a wood-burning stove at this location where the wind direction was blowing from an unfavorable direction. The graph below shows the PM2.5 particulate matter concentration for that day.
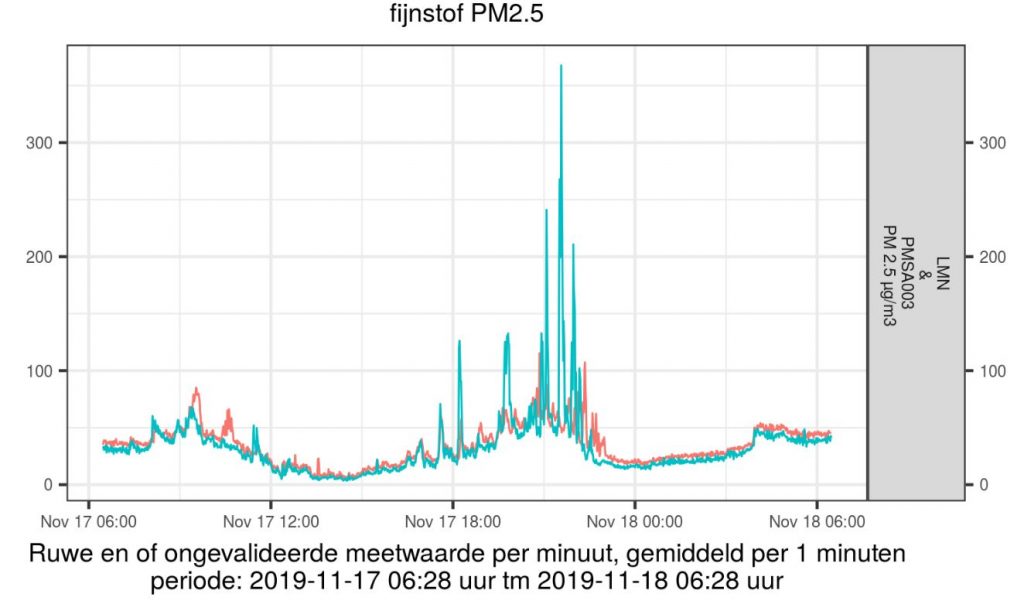
We can clearly see the particulate matter concentration rising from 6 pm and considerable peak values appearing up to a maximum of approximately 375 µg / m3 PM2.5. Remember that the WHO daily standard is 25 µg / m3, so that it becomes clear how high these concentrations are. This concerns data from two sensors on two sides of the house, hence the blue and red curve. You can clearly see that there was far more wood smoke on one side of the house than on the other. That also immediately indicates the capriciousness of wood smoke nuisance, which can strongly depend on the wind direction.
The graph below shows the concentration of PM2.5 particulate matter at the same location during the New Year.
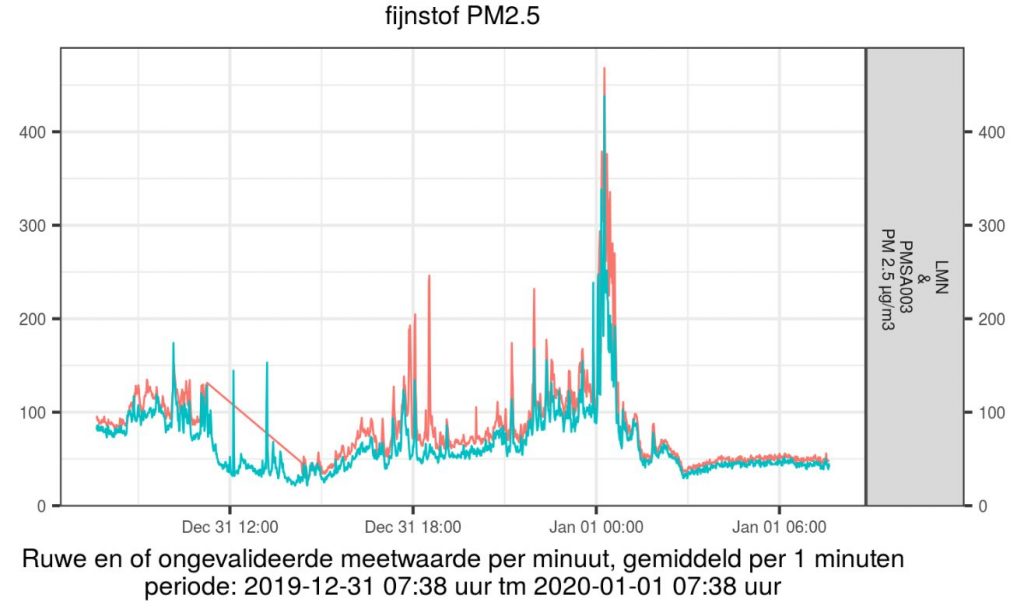
We see that just after midnight the particulate matter concentration PM2.5 rises rapidly to a peak value of around 450 µg / m3. Now you will think that the fireworks have won from the wood stove, but the graphs are a representation of 1 minute averages based on observations every 20 seconds. If we take a closer look at the measurement data on the basis of 20 second observations, the truth will be revealed!
The “box plot” below shows the statistical processing of PM2.5 particulate matter per day. An explanation about the box plot can be found here. The outliers can also be seen for every day.
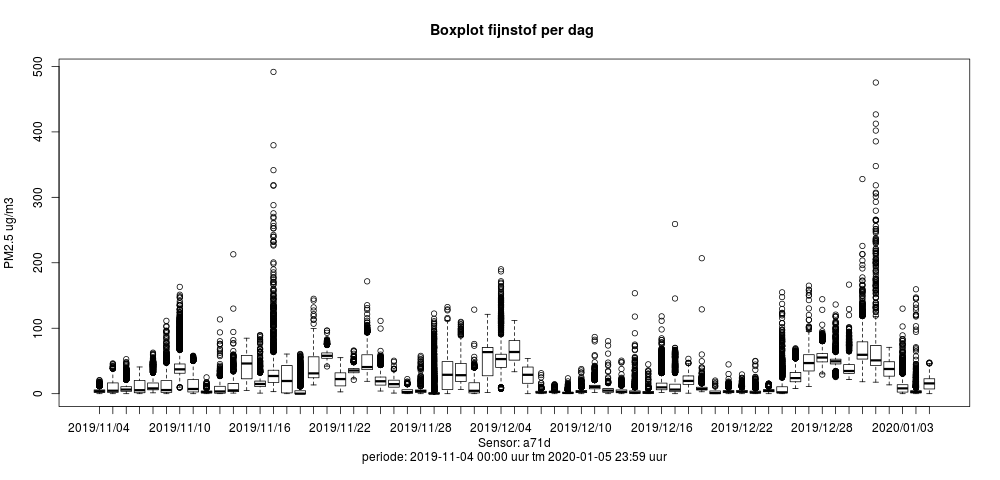
If we zoom in on 17 November 2019, we see that there has been an outlier with a concentration of approximately 490 µg / m3 PM2.5. If we zoom in on New Year’s Day, we see that there was an outlier on 1 January 2020 with a concentration of approximately 475 µg / m3 PM2.5.
The graph below shows the maximum values (green) for PM2.5 that the sensors have measured per day. You can clearly see that the maximum measurement value of 17 November 2019 is higher than the maximum measurement value of 1 January 2020.
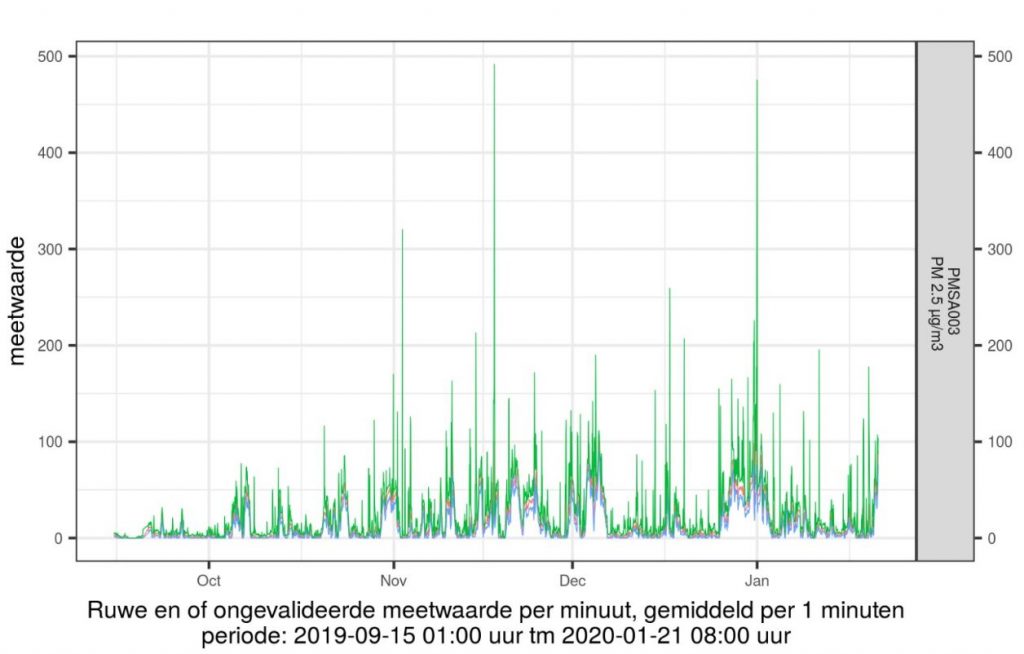
We can therefore conclude that the wood-burning stove has won the fireworks during the New Year!
This blog is of course meant to be a little playful, but we would like to give you an important message. You can consider a wood-burning stove as a point source that can emit extremely much particulate matter. In addition, a wood stove emits many more harmful and even carcinogenic substances such as benzene and poly-aromatic hydrocarbons (PAHs). Let us be aware that a wood-burning stove is not a clean and sustainable source for heating your home. There are enough alternatives available today that are much cleaner and more sustainable.

")
